Rесурсы. Хорошие книги для изучающих R
Обновлено 24 ноя 2023.
Собрал ссылки на хорошие книги по R. Все на английском языке. Все бесплатно доступны в онлайне, но также можно купить бумажные издания.
Для доступа к некоторым книгам понадобится Ви-Пи-Эн.
Использование R
Advanced R. Второе издание.
The book is designed primarily for R users who want to improve their programming skills and understanding of the language. It should also be useful for programmers coming to R from other languages, as help you to understand why R works the way it does.
R for Data Science. Второе издание.
This book will teach you how to do data science with R: You’ll learn how to get your data into R, get it into the most useful structure, transform it and visualize.
Дендрограммы
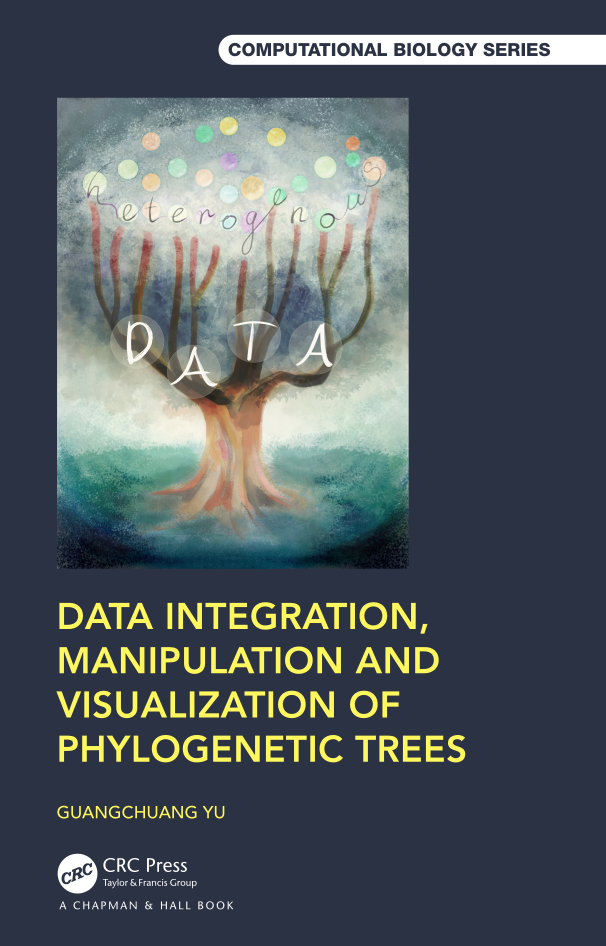
Data Integration, Manipulation and Visualization of Phylogenetic Trees.
Рассказывает как строить дендрограммы и филогенетические деревья с помощью пакета ggtree. Есть глава, где говорится как прикрутить картинки к дендрограмме.
Статистическое моделирование
Tidy Modeling with R.
This book is a guide to using a collection of software in the R programming language for model building called tidymodels, and it has two main goals:
- First and foremost, this book provides a practical introduction to how to use these specific R packages to create models. We focus on a dialect of R called the tidyverse that is designed with a consistent, human-centered philosophy, and demonstrate how the tidyverse and the tidymodels packages can be used to produce high quality statistical and machine learning models.
- Second, this book will show you how to develop good methodology and statistical practices. Whenever possible, our software, documentation, and other materials attempt to prevent common pitfalls.
Визуализация
R Graphics Cookbook. Второе издание.
A practical guide that provides more than 150 recipes to help you generate high-quality graphs quickly, without having to comb through all the details of R’s graphing systems. Each recipe tackles a specific problem with a solution you can apply to your own project, and includes a discussion of how and why the recipe works.
ggplot2: Elegant Graphics for Data Analysis. Третье издание.
While this book gives some details on the basics of ggplot2, its primary focus is explaining the Grammar of Graphics that ggplot2 uses, and describing the full details. It is not a cookbook, and won’t necessarily help you create any specific graphic that you need. But it will help you understand the details of the underlying theory, giving you the power to tailor any plot specifically to your needs.
Статьи
«Кто за всех решил, что Python удобен для „гражданской“ аналитики?», — объясняет, почему R лучше Питона.